Most property software gets reporting backwards. It gives you three summary tiles on a dashboard, and when you need the actual numbers for a lender, a partner or a CPA, you export a transaction list and rebuild the report yourself in a spreadsheet.
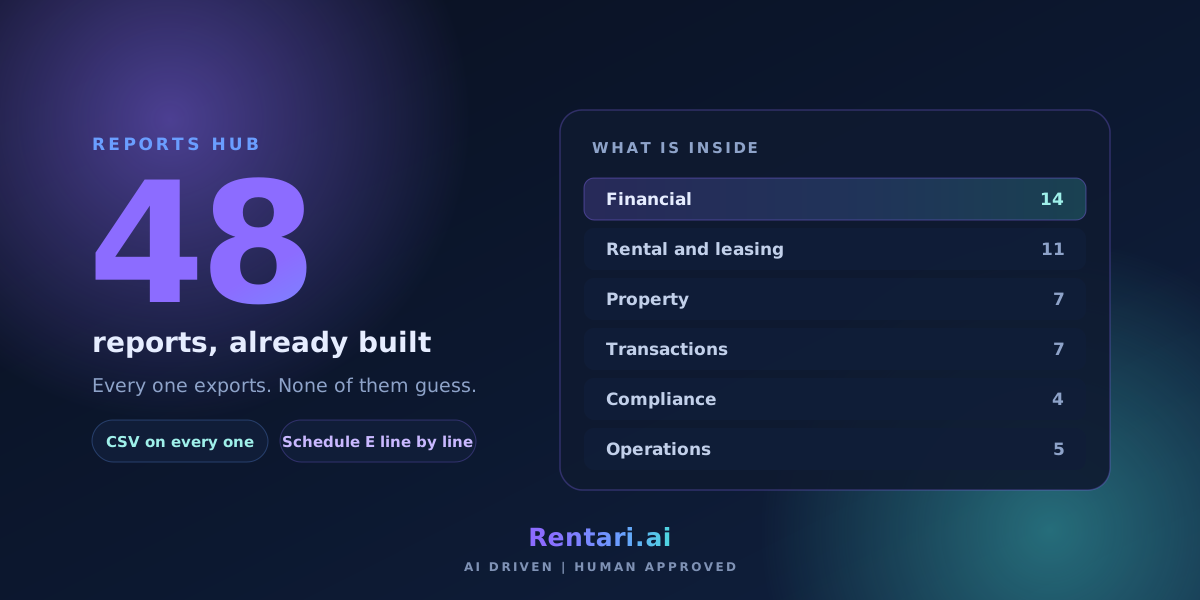
Rentari ships 49 reports, already built. They live in one place, they run on your real data, and every one of them exports.
What is actually in there
The Reports Hub is grouped the way you think about the portfolio, not the way a database is organized:
- Financial, 14 reports. Profit and loss, general ledger, trial balance, balance sheet, cash flow, owner statements, A/R aging, unpaid bills.
- Rental and leasing, 11 reports. Rent roll, lease expirations, renewals, delinquency, vacancy and turnover.
- Property, 7 reports. Per-property performance, NOI, and the operating detail underneath it.
- Transactions, 7 reports. Payments, deposits, refunds, vendor payouts, and the audit trail behind each.
- Compliance, 4 reports. Deposit handling, required disclosures, and the records a regulator or an insurer asks for.
- Operations, 6 reports. Maintenance load, vendor performance, and where your time actually goes.
Every report exports to CSV, which opens in Excel or Google Sheets. The financial statements also render as a formatted PDF, because a lender wants a document and not a spreadsheet.
The part we care about most
A report that invents a number is worse than no report at all, because you will act on it.
So Rentari's reports are built to refuse. Run a balance sheet on a portfolio with no activity in the period and you get an empty state that says so, not a page of confident zeros. Charts do not interpolate a trend line through two data points. A connected bank account with no balance available shows you that it has no balance available, rather than filling the gap with something plausible.
That sounds like a small thing. It is the difference between a report you can forward to your accountant and a report you have to check first.
The links are checked by a test, not by hope
Here is an unusual detail. Every tile in the Reports Hub points at a real, registered page, and that is enforced by an automated test that runs against the build. If someone adds a report tile whose destination does not exist, the test fails and the code does not ship.
The same test enforces the reverse. A report that is planned but not finished is not allowed to carry a link at all, so nothing in the hub can look clickable and quietly go nowhere.
At tax time
The work that usually eats a weekend in April is mostly done by then:
- Schedule E, line by line. Every transaction is mapped to its IRS Schedule E category as it posts, so the year-end summary adds up by line instead of being reconstructed by hand.
- 1099-NEC totals per vendor. Paid vendors are totalled for the year with the reporting threshold tracked for you.
- Depreciation. A year-by-year straight-line schedule per asset. Treat it as a well-organized starting point, not as a filed return. Your CPA finalizes Form 4562.
- A QuickBooks Online journal file. A CSV formatted for QuickBooks Online's journal-entry import, with balanced entries, so your bookkeeper is not retyping the year.
Honest about what it is not
Rentari's books are single-entry with a full audit trail: every transaction categorized, every action logged with who did what and when. The balance sheet is cash basis, and unpaid rent and deposits held are disclosed as memo lines rather than buried in the math. The trial balance is ledger basis with an explicit owner's equity line.
That is genuinely enough for a landlord, a partner and most CPAs. If a lender or a partner needs statements signed off under formal accounting standards, that is an accountant's job, and these reports are exactly what you hand them.
You can see the whole hub on the reporting page, or look at how the ledger categorizes transactions in the first place on the accounting page.