Help Center • Tenants • Get Paid
View money insights
Track your rent payments, balance due, upcoming charges, and payment trends in interactive charts.
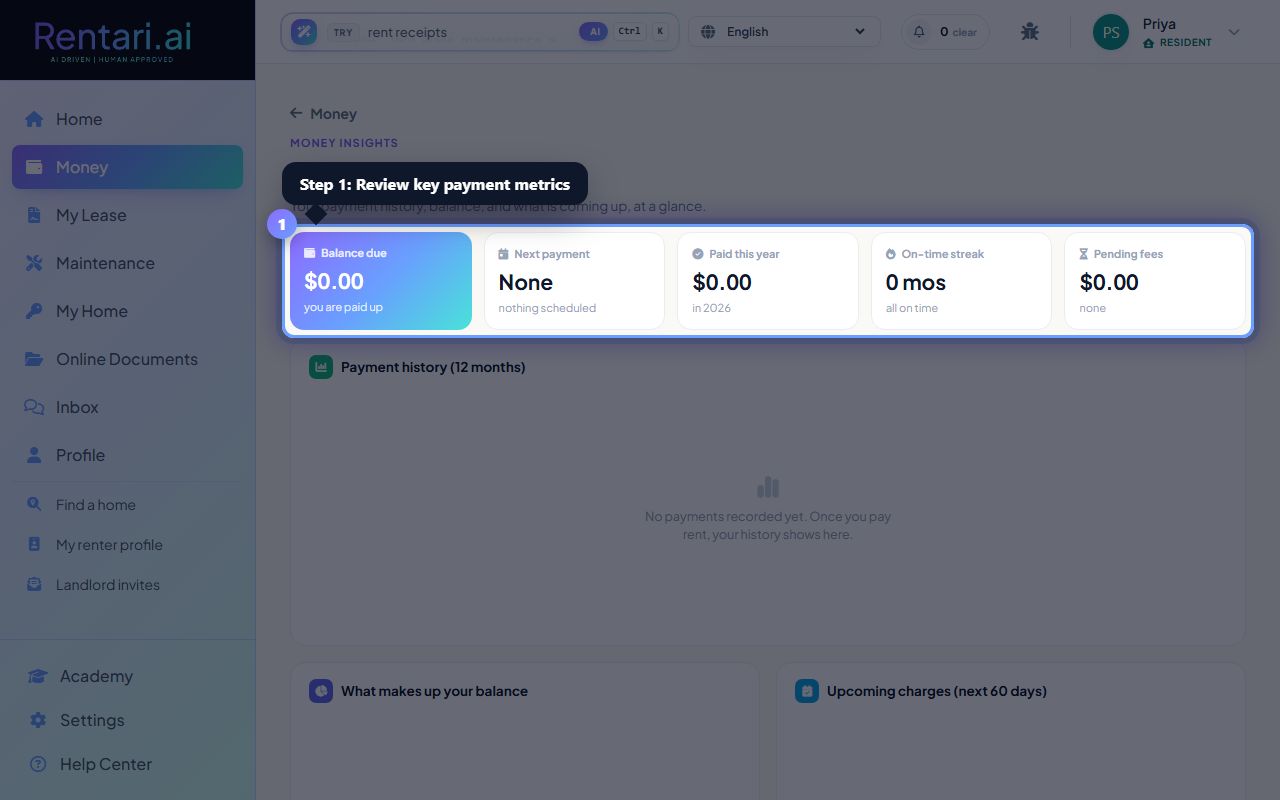
Review key payment metrics
Action: The page displays five KPI tiles at the top: Balance due (lead tile with gradient), Next payment due date and amount, Paid this year in dollars, On-time payment streak in months, and Pending fees. Each tile shows an icon, value, and descriptive text.
The 'Balance due' tile is highlighted with the brand gradient and shows whether you're due now or paid up. On-time streak shows in green if positive, and pending fees show in red if any exist.
Analyze payment history
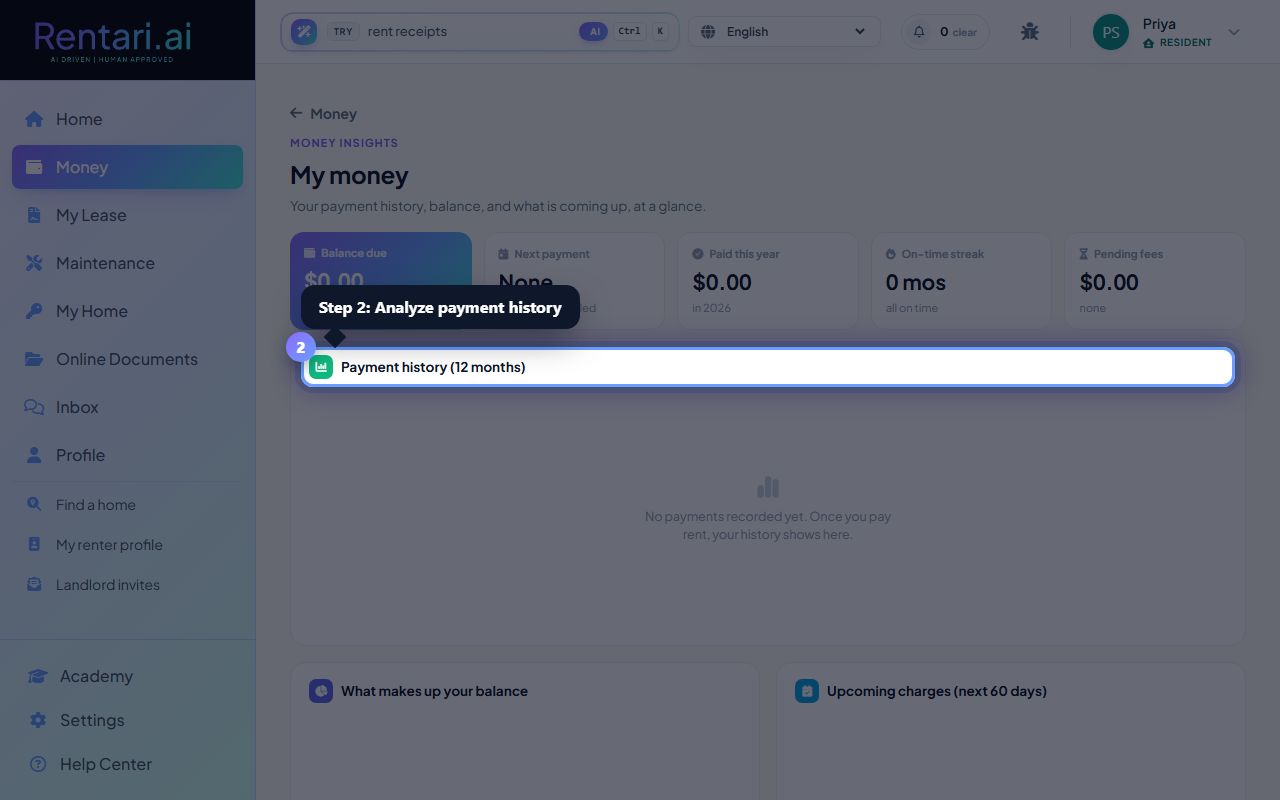
Action: A stacked bar chart titled 'Payment history (12 months)' displays your rent payments (green bars) and fees/other charges (red bars) side by side for each month. Hover over bars to see exact amounts.
If no payments have been recorded yet, the chart shows 'No payments recorded yet. Once you pay rent, your history shows here.'
Review balance and upcoming charges
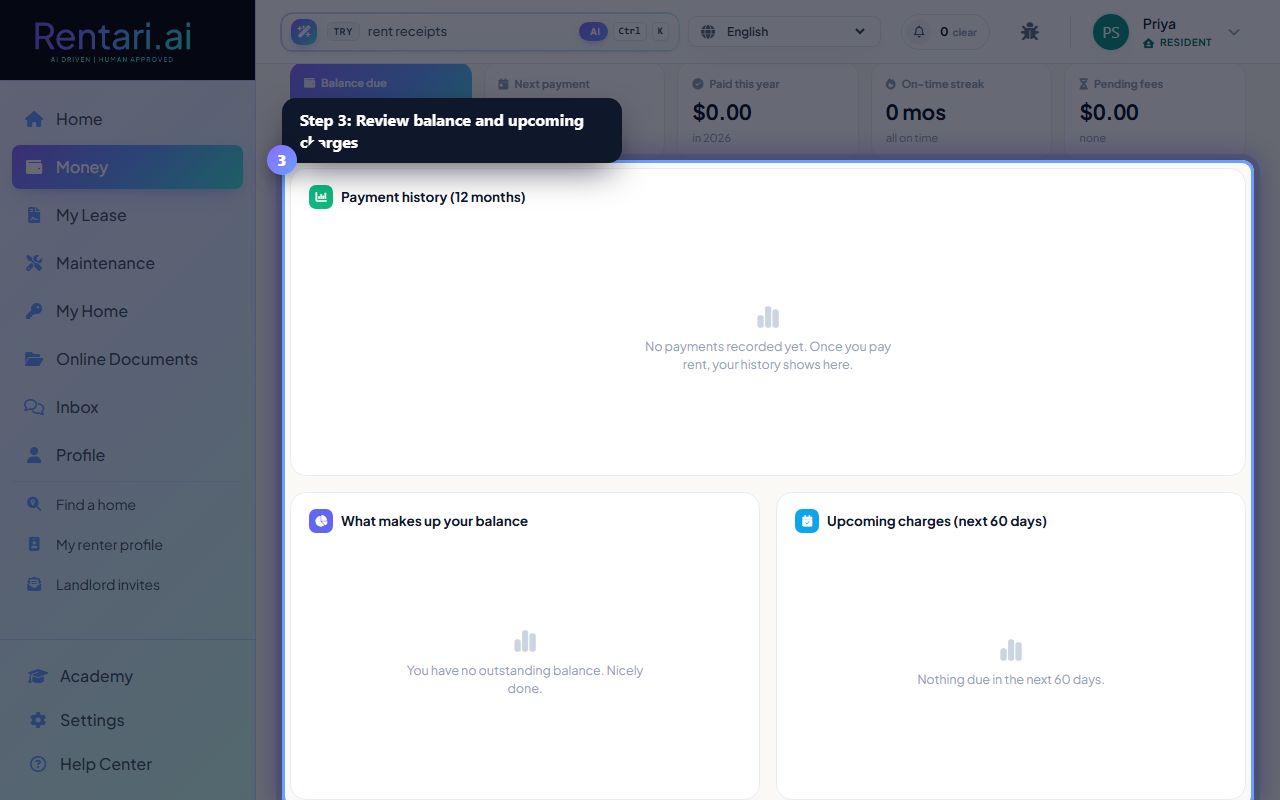
Action: A doughnut chart shows 'What makes up your balance' with a center label displaying total due. A bar chart shows 'Upcoming charges (next 60 days)' with a bar per charge type. Both charts update based on your lease data and scheduled payments.
If your balance is zero, the doughnut shows 'You have no outstanding balance. Nicely done.' with a checkmark. Upcoming charges chart shows only if charges exist within 60 days.