Help Center • Landlords • Accounting & Reports
View portfolio analytics
Dashboard showing portfolio value, occupancy, cash flow, NOI, cap rate, delinquency, expenses, and leasing trends with export options.
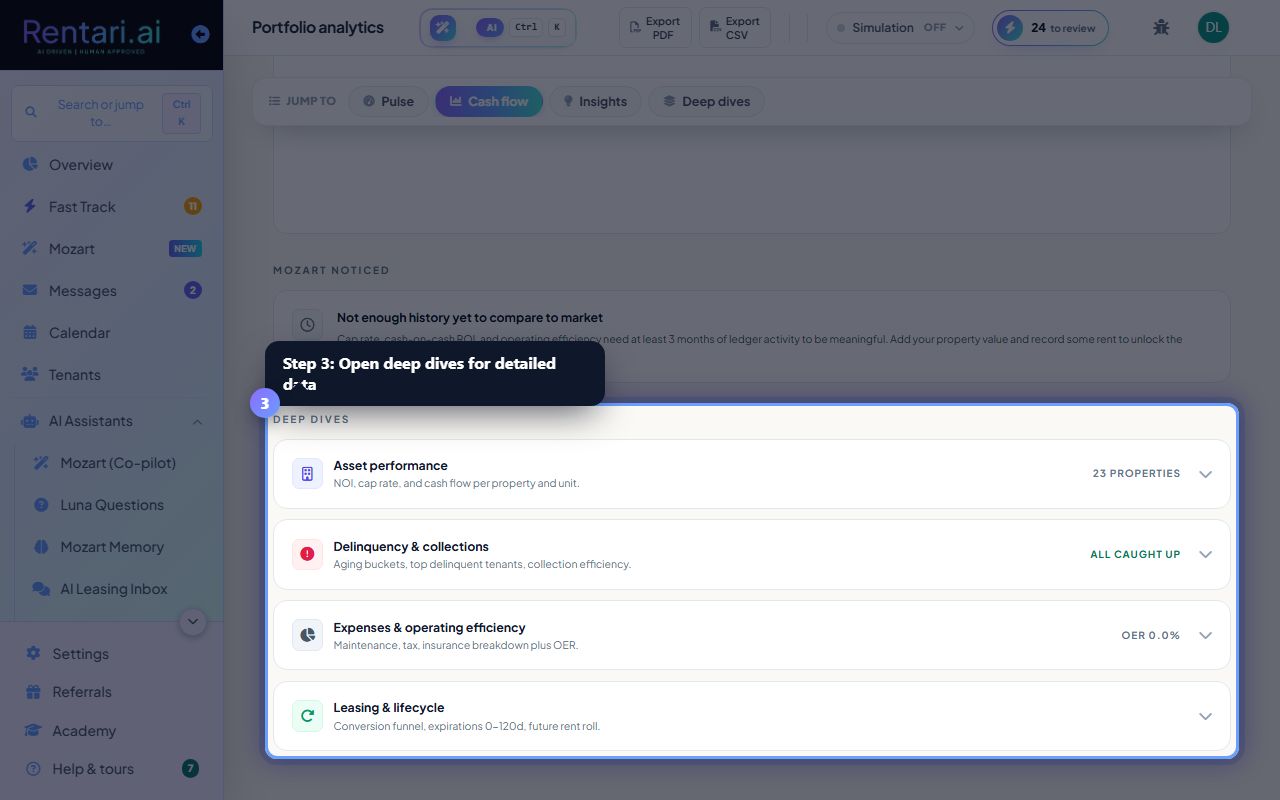
View portfolio pulse metrics at the top
Action: On the Analytics page, the Portfolio pulse card shows four key numbers: Portfolio value (from values you entered), Occupancy rate (live), Cash flow per unit (monthly), and Renewal rate (12-month trailing). These are your portfolio's vital signs.
Portfolio value must be entered manually on the Properties page; occupancy and cash flow are auto-calculated from active leases and payments. If you see thin data (no value entered or no rent collected yet), a neutral card explains why analytics are unavailable.
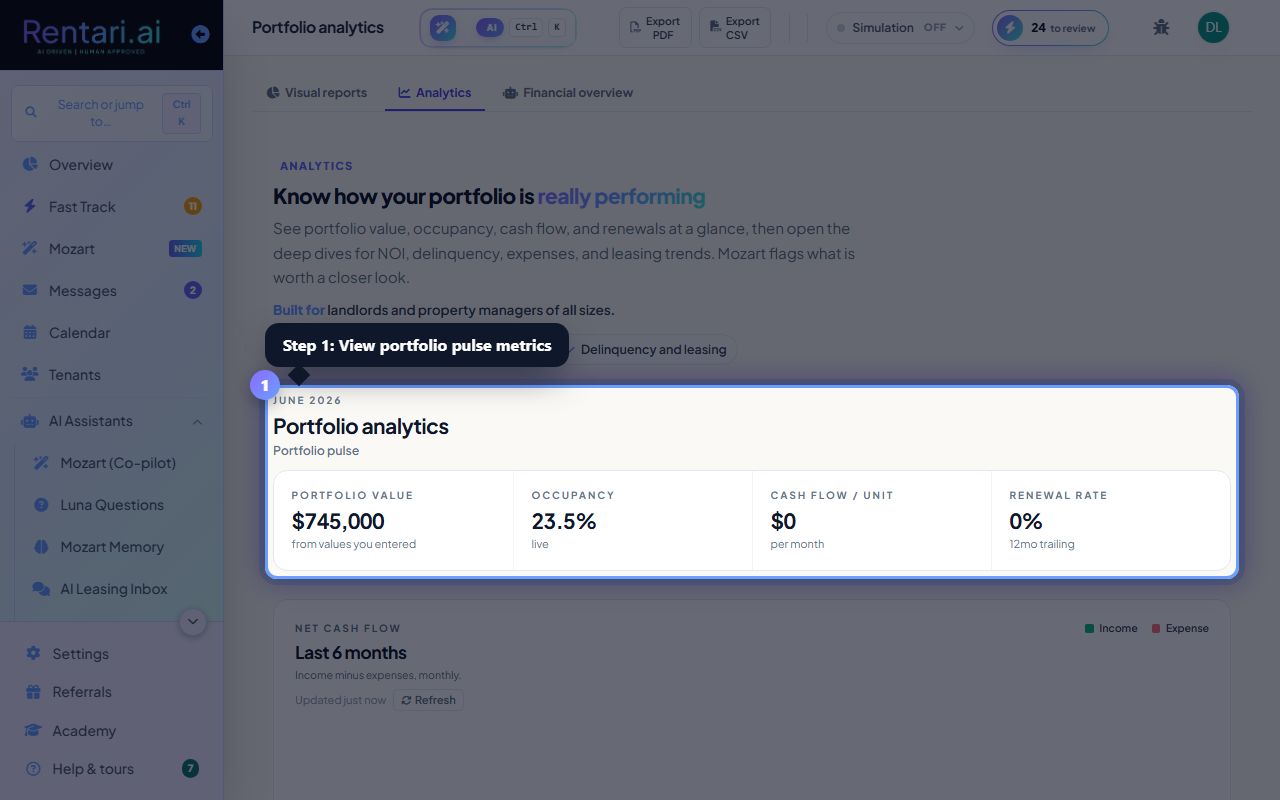
Review the 6-month cash flow chart and Mozart insights
Action: Scroll to the Cash flow chart showing last 6 months of income vs expenses. Below that, the Mozart noticed section flags items worth investigating: lost revenue, high delinquency, rising expenses, or leasing gaps. Each insight is a suggestion; click the action link (e.g. View Analytics) to drill down.
The chart updates when you record rent or expenses. Click Refresh to re-fetch analytics from the latest ledger (a full page reload computes fresh). Mozart proposes insights; you decide the next step.
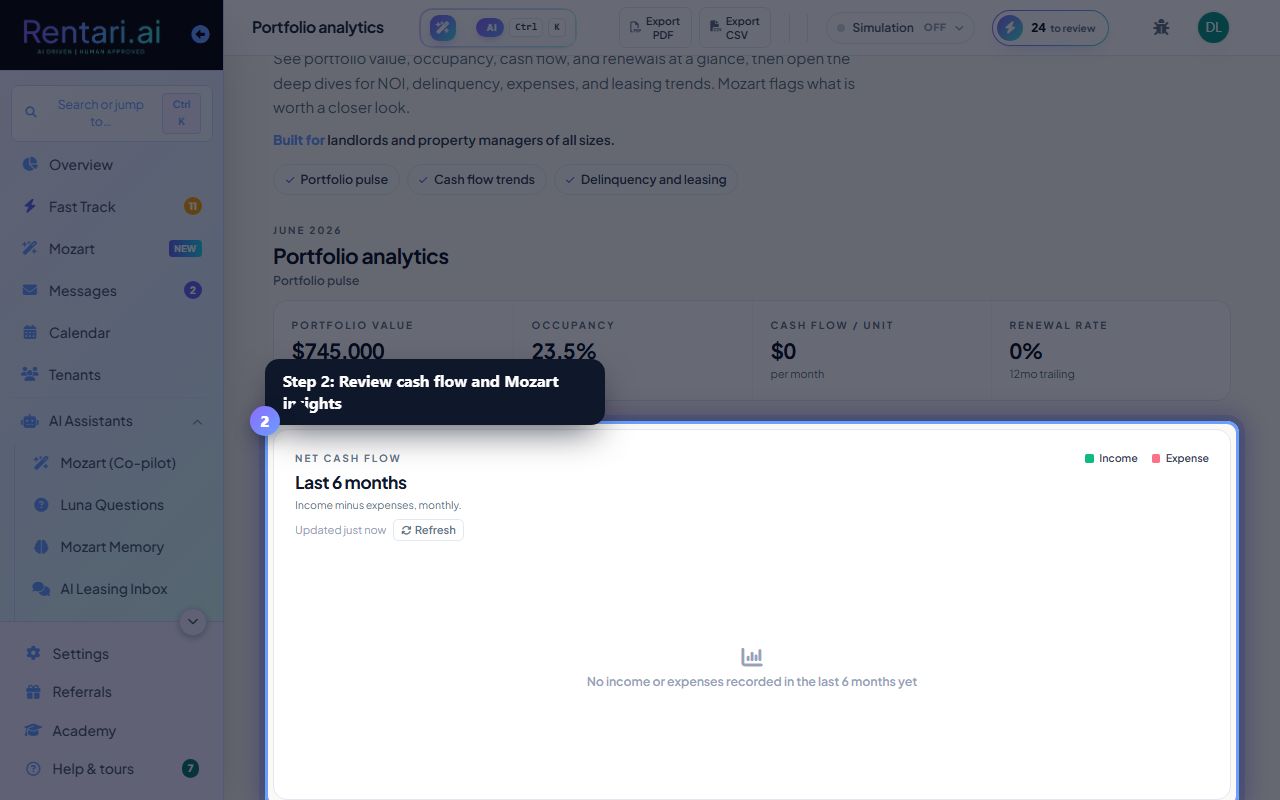
Open deep dives for detailed breakdowns
Action: Click the collapsible sections: Asset performance shows NOI and cap rate per property, Delinquency & collections lists aging buckets and top delinquent tenants, Expenses & operating efficiency shows a pie chart of maintenance, tax, insurance, and other, Leasing & lifecycle shows your conversion funnel and lease expiration timeline. Click Export PDF or Export CSV at the top to download a summary.
Deep dives are lazy-loaded: charts only paint when you open them, so the page loads fast. Each section is collapsible; open only what you need to investigate. Cap rate is calculated only when portfolio value and NOI are both real (never fabricated).