Help Center • Landlords • Accounting & Reports
View visual reports
See all your key reports (cash flow, collections, expenses, occupancy, leases, maintenance, vendors) as interactive charts with drill-down and cross-filtering.
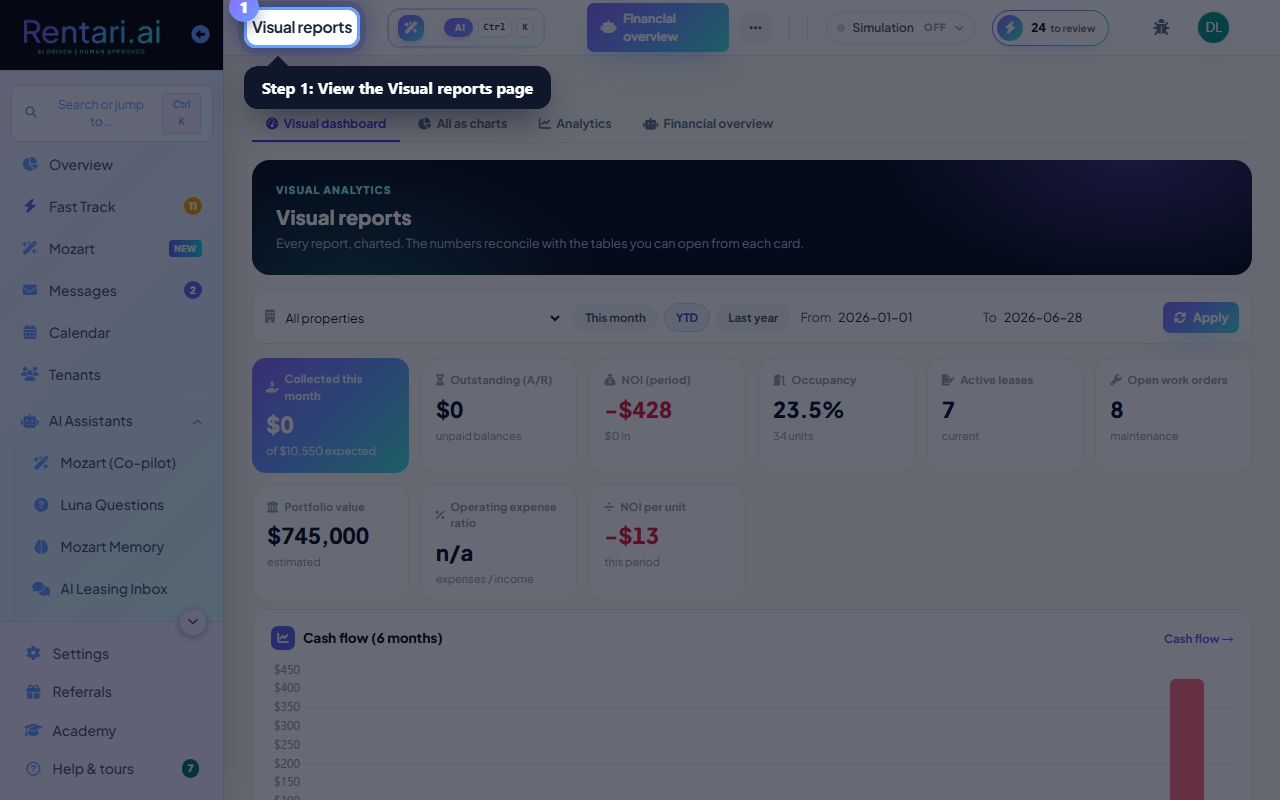
Filter by property and date range
Action: At the top, choose a Property (blank = all), pick a preset (This month, YTD, Last year) or enter custom From and To dates, then click Apply. The page refreshes with filtered data.
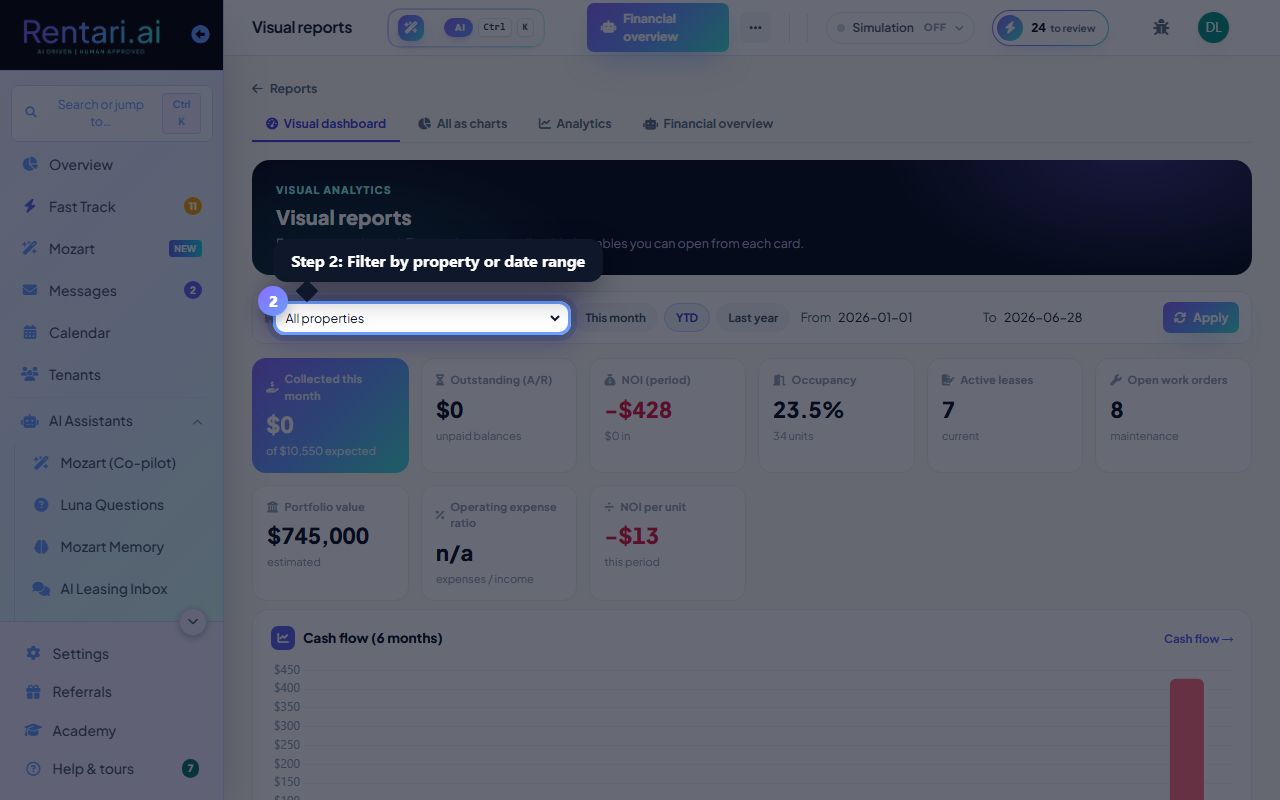
Scan the KPI strip and chart grid
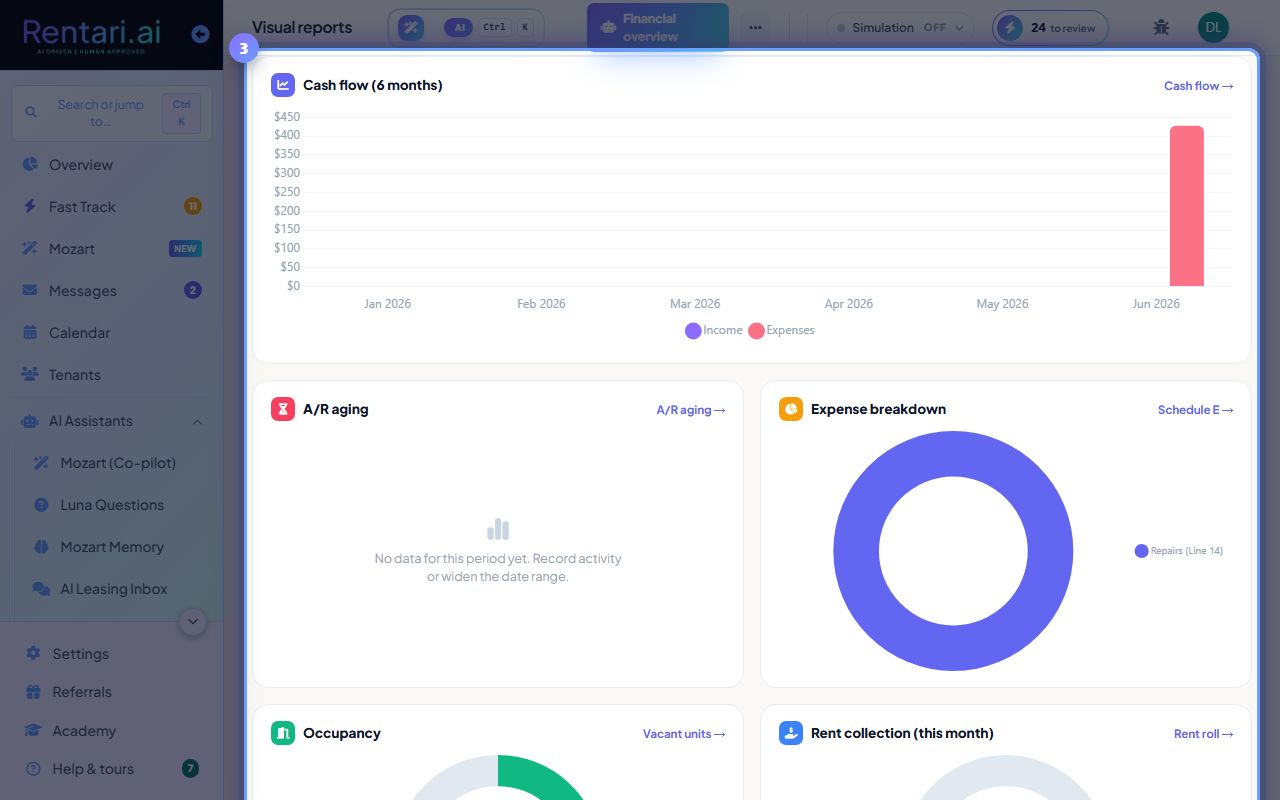
Action: The leading KPI card shows Collected this month, Outstanding A/R, NOI, Occupancy, Active leases, and Open work orders. Below, interactive charts display: Cash flow (grouped bars), A/R aging, Expense breakdown, Occupancy doughnut, Rent collection, NOI by property, NOI by unit, and more.
Click a chart segment to drill into the table report
Action: Most charts are clickable. Click a bar, slice, or segment to jump to the detailed table report (e.g. click a month in Cash flow to see transactions for that month, or click an A/R bucket to see aged invoices). Filters (property, dates) carry over. Click View report or its arrow link to open the full table.