Every property manager has done this. You need one number for a lender, a partner or an accountant, the reports menu has forty-nine reports and none of them is that number, so you export a transaction list and rebuild the thing by hand in a spreadsheet. Next quarter you do it again, because the spreadsheet was a one-off and nobody wrote down how you made it. Rentari now lets you build the report instead, save it, and open it next quarter with this quarter's data already in it.
Start with where the data already lives
A report builder that starts from a blank page is a database query tool with better manners, and most landlords rightly close it. So this one starts by asking a much smaller question: which part of your portfolio are you reporting on?
You pick one of the places your data already lives:
- Ledger. Every charge and payment, the full money history.
- Payments received. Only what actually came in, when, and by which method.
- Leases. Terms, rent, dates, deposits, status.
- Tenants and Units. Who lives where, and what the unit is.
- Work orders and Vendors. The maintenance load and who carried it.
- Applicants. The leasing funnel ahead of all of it.
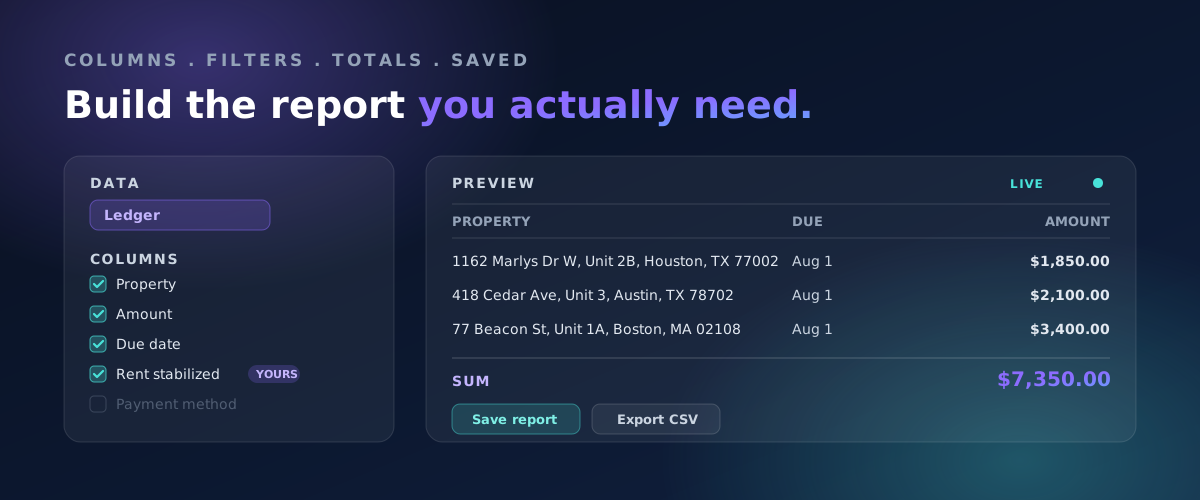
Each one arrives with its columns already labelled in plain language, joined to the things you would expect. Pick the ledger and the property and unit are there beside the amount, because a rent line without an address is not a report, it is a puzzle.
Columns, filters, totals, and a preview that keeps up
From there it is four choices, and you can see the result of each one immediately.
- Columns. Tick what you want to see. Up to twenty.
- Filters. Narrow it down. Up to twelve, and each field only offers the comparisons that make sense for it, so a date offers before and after while text offers contains and starts with. You cannot accidentally ask a question the data cannot answer.
- Grouping. Roll the rows up by property, by month, by vendor, by whatever you grouped your thinking by.
- Totals. Sum, average, minimum, maximum, count, or count of distinct values. This is where a list of transactions turns into an answer.
A preview runs as you go, so you are not saving a report to find out what it does. It shows the first hundred rows, which is enough to see whether you built the right thing, and it refreshes a beat after you stop clicking rather than on every keystroke.
When you export, the cap is fifty thousand rows, which is a portfolio-scale number rather than a spreadsheet-demo number.
The columns you invented count as real columns
Every portfolio tracks something the software did not think of. A boiler service date. Which properties are in the 2019 refinance. Whether a unit is rent stabilized. A parking space number. Landlords have always kept these somewhere, and that somewhere is usually a spreadsheet that nothing else can see.
Rentari lets you define your own fields on properties, units, leases, tenants and vendors, as text, a number, a date, a dropdown, a checkbox or a money amount. That much is not unusual. What matters here is what happens next: those fields show up in the report builder as ordinary columns. You can filter on them, sort by them, group by them, and if the field holds a number or an amount, total it.
So the thing you track that is specific to how you run your portfolio stops being a note nobody can query. Report on rent stabilized units only. Total the spend by which refinance a property sits in. Group work orders by the internal category you actually use rather than the one we guessed at.
A note on the boring part
The joins underneath only ever walk from a row toward the thing that owns it: a ledger line to its unit, that unit to its property. That direction is deliberate. Join the other way and one row fans out into several, a total quietly counts the same money twice, and you get a number that is wrong rather than an error that is obvious. A wrong number on a money report is the worse of the two, because you will act on it.
Save it, and it behaves like one of ours
A saved report is not a second-class citizen. It opens in the same viewer as the built-in reports, with the same export to CSV and the same print layout, so what you hand a lender does not look like it came out of a side door. Give it a name you will recognise in a year. You can keep up to two hundred of them.
You can also share one with your team, and this is where a small design decision earns its keep. Sharing a report never widens who may see the data inside it. Permission is checked when the report is opened, not when it was saved, so a report built on financial data stays closed to somebody whose role does not include financial data, no matter who shared it with them or when. The report is shared. The access is not.
A separate set of books for each LLC
If you hold property in more than one entity, you already know the pain: the software shows you one portfolio, your accountant needs three sets of numbers, and the reconciliation happens in your head.
Rentari now lets you keep one set of books per legal entity. Each book gets its own chart of accounts, you assign properties to the entity that actually owns them, and financial reports can be run for one entity instead of only for everything at once. A solo landlord has exactly one book, never thinks about it, and loses nothing.
The part worth knowing: assignment is dated. If you move a property from one LLC to another in June, last quarter's report still resolves the entity that owned it last quarter. Nothing rewrites history to match today's structure, which is the behaviour you want the first time somebody asks you to explain a prior year.
What the builder will not export, on purpose
A tool that can select any column from any table is a data breach with a nice interface. So the set of things this builder can reach is written down by hand, field by field, and nothing outside that list is reachable at all. A column that is not on the list cannot be selected, filtered, sorted or grouped. It is not hidden behind a permission, it is absent.
Two categories are deliberately left out, and we would rather say so than have you discover it and wonder:
- Identifiers we hold encrypted. Social security numbers, dates of birth, vendor tax IDs. These are encrypted where they sit, and a bulk export is exactly the shape of the risk encryption exists to prevent.
- Applicant credit and background data. Credit scores, collections, inquiries, background check results. You can view these on the applicant you are considering, where the law that governs consumer reports expects you to be. Exporting all of them into a spreadsheet is a different act with different obligations, and it is not a default we are willing to pick for you.
Everything a report runs is also scoped to your portfolio at a level a saved configuration cannot reach or override. A report cannot be talked into returning somebody else's rows, because the boundary is not part of what you configured.
The point of all of it
Reporting menus are a promise that somebody, at some point, guessed what you would need. Forty-nine guesses is a good number of guesses. It is still guessing.
What you actually need is usually one question, asked in your own terms, about the way you happen to run your portfolio. Ask it once, save it, and it is there next quarter with next quarter's numbers in it. That is the whole idea, and everything above is what it took to make it safe enough to leave switched on.