
The pulse is the thirty second version
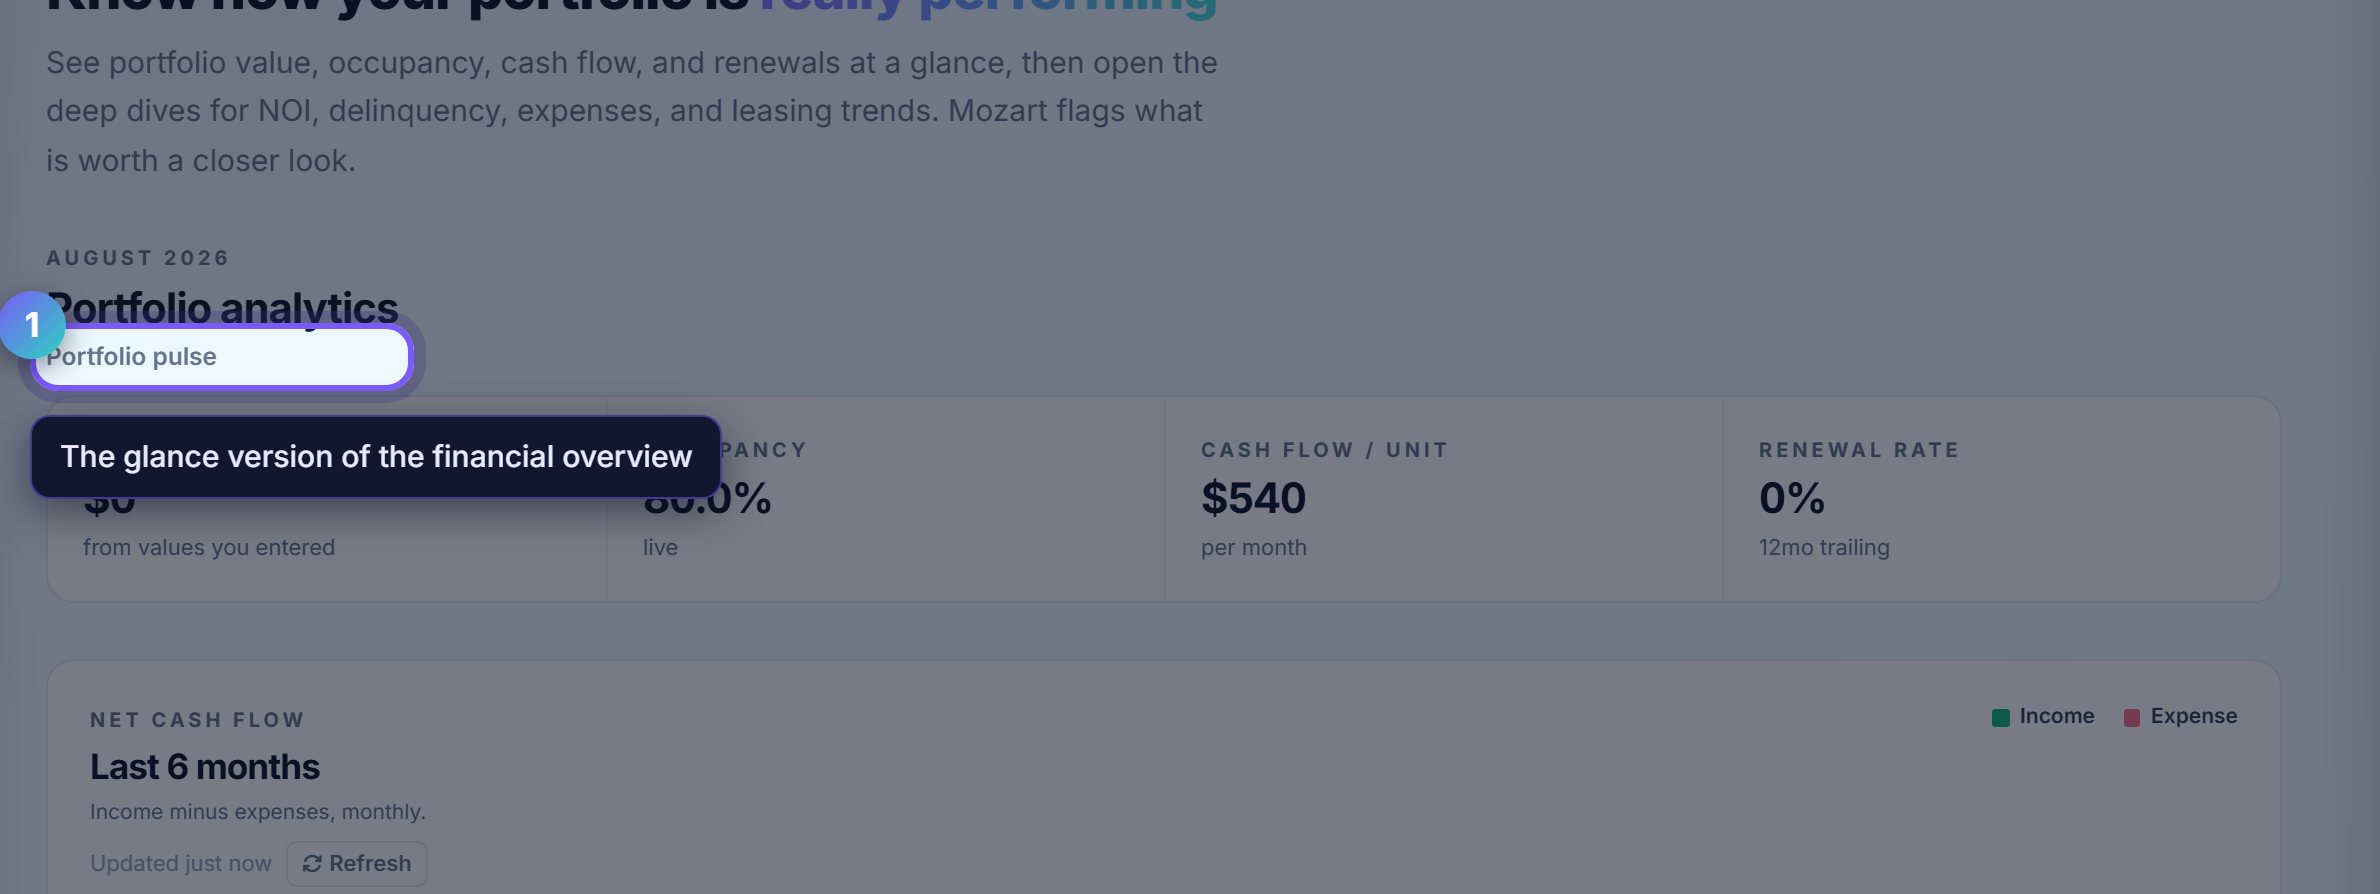
Portfolio pulse is the handful of numbers worth knowing without opening anything: occupancy, rent roll, what is outstanding.
It is the same data as the financial overview, cut for a glance rather than for an accountant.
Six months is the shortest honest trend
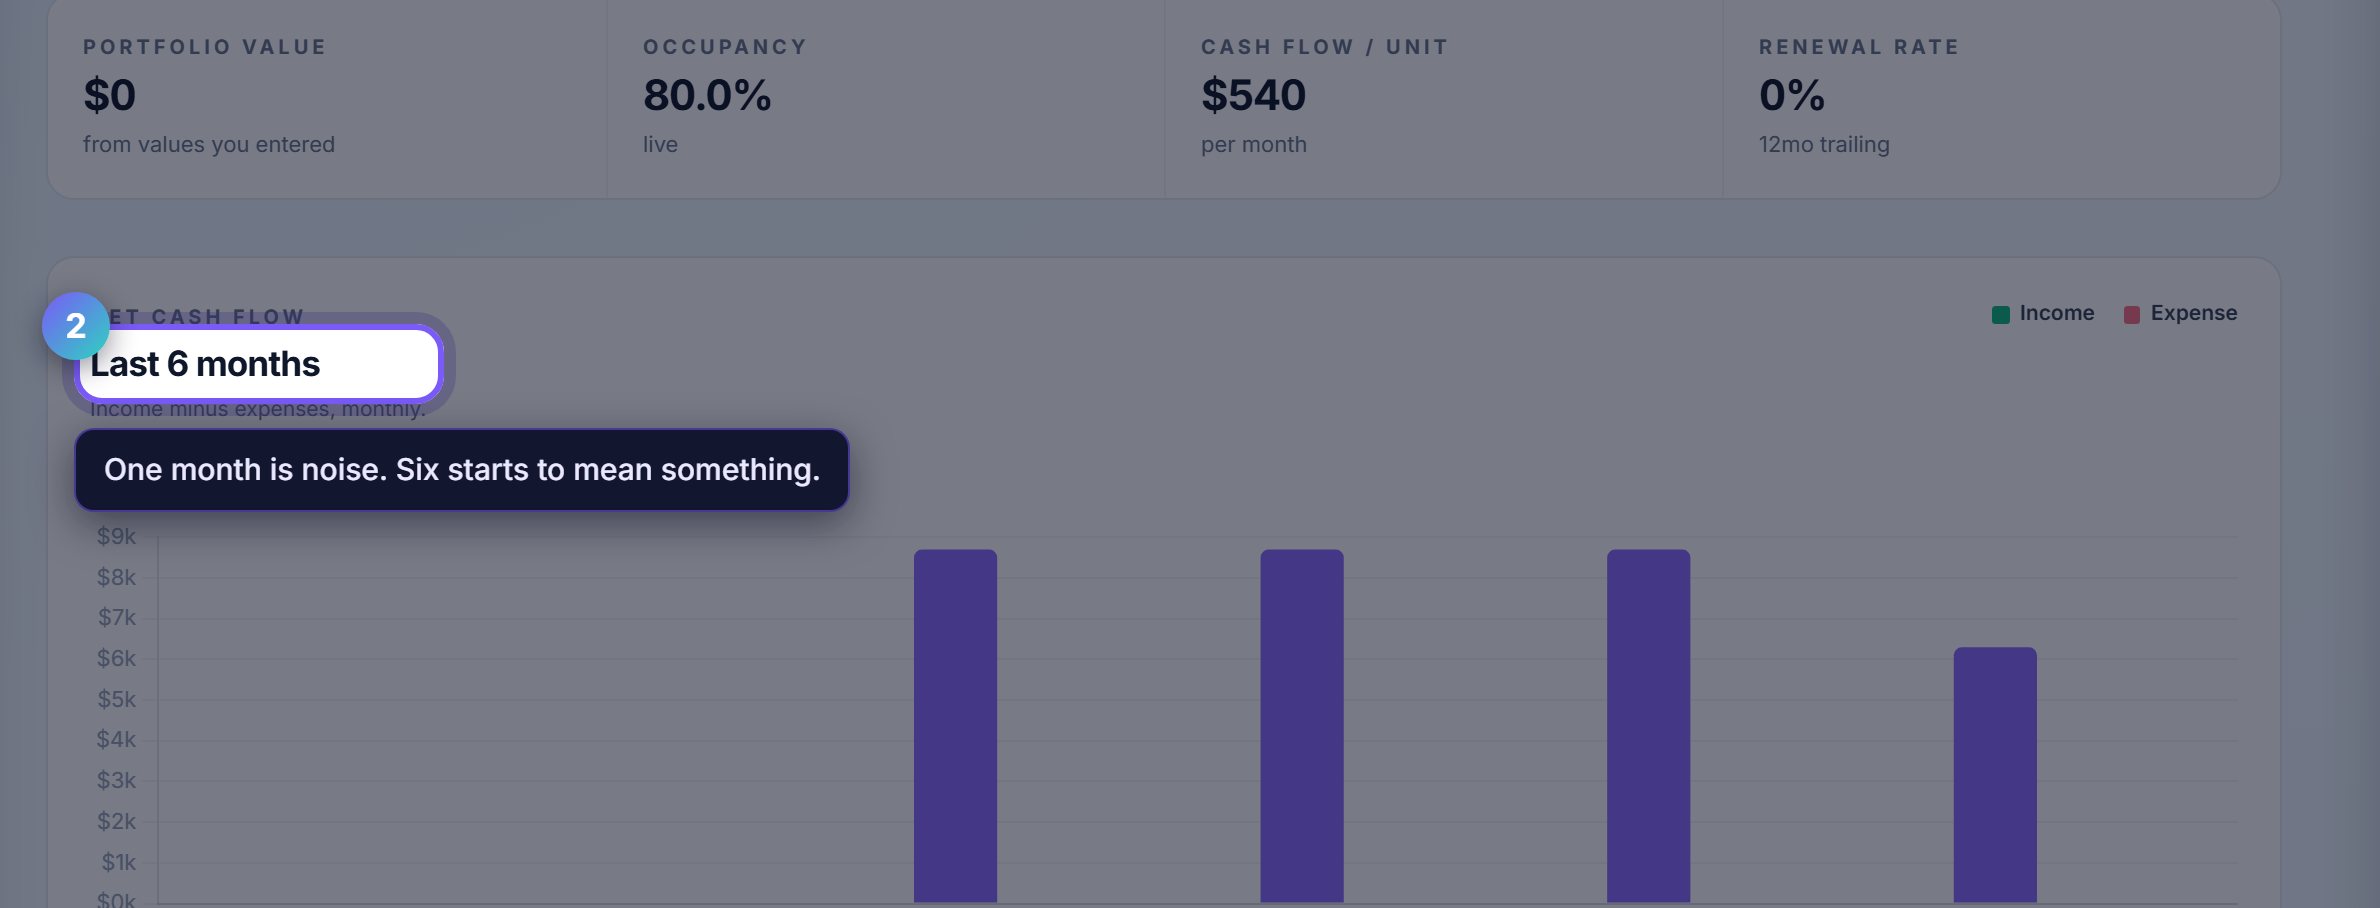
One month is noise. The six month cash-flow chart is where a real pattern starts to show, which is why it is the default window.
If you have less history than that, the page says so instead of drawing a line through two points and calling it a trend.
Mozart noticed is the part worth reading
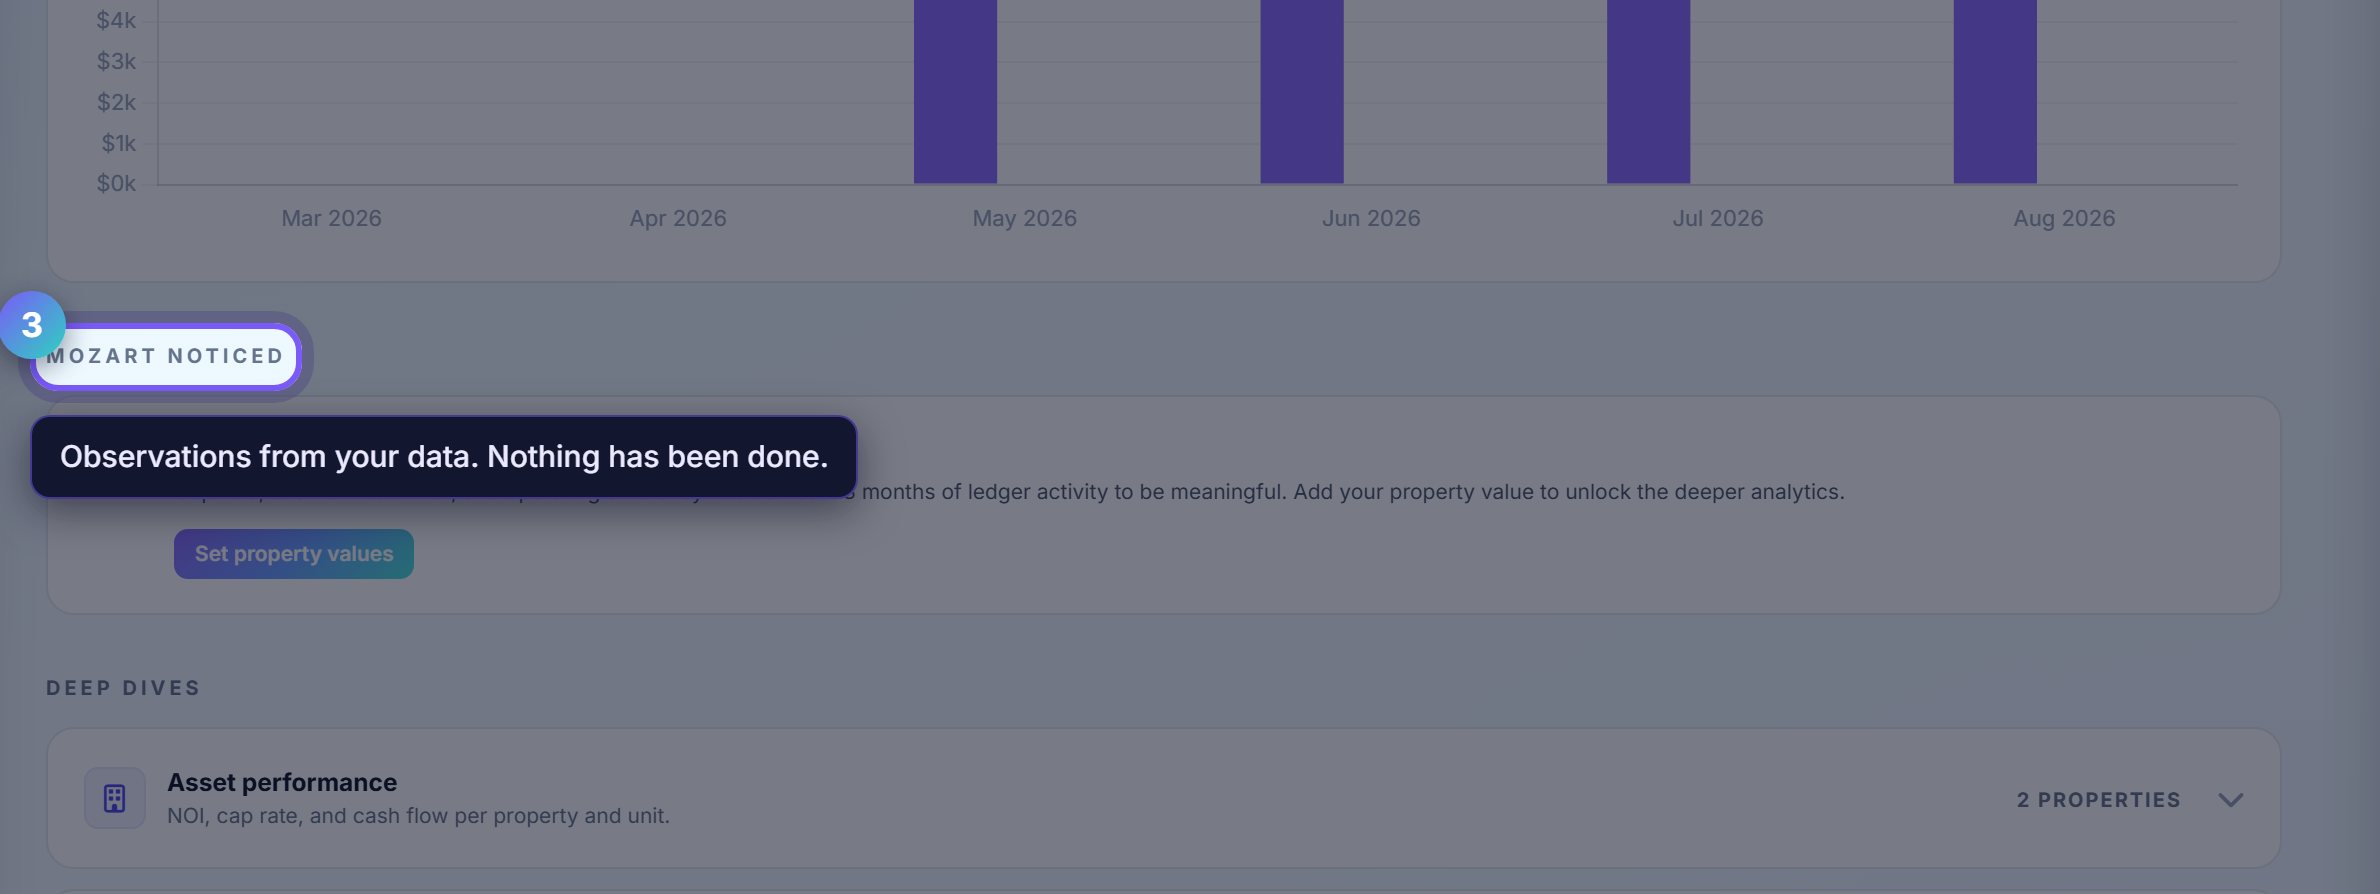
This block is written from your data: a property drifting below market, a tenant whose payment timing is slipping, an expense category that jumped.
It is observation, not action. Nothing here has been done to your portfolio, and each note names what it was reading so you can check it.
Deep dives answer the follow-up question
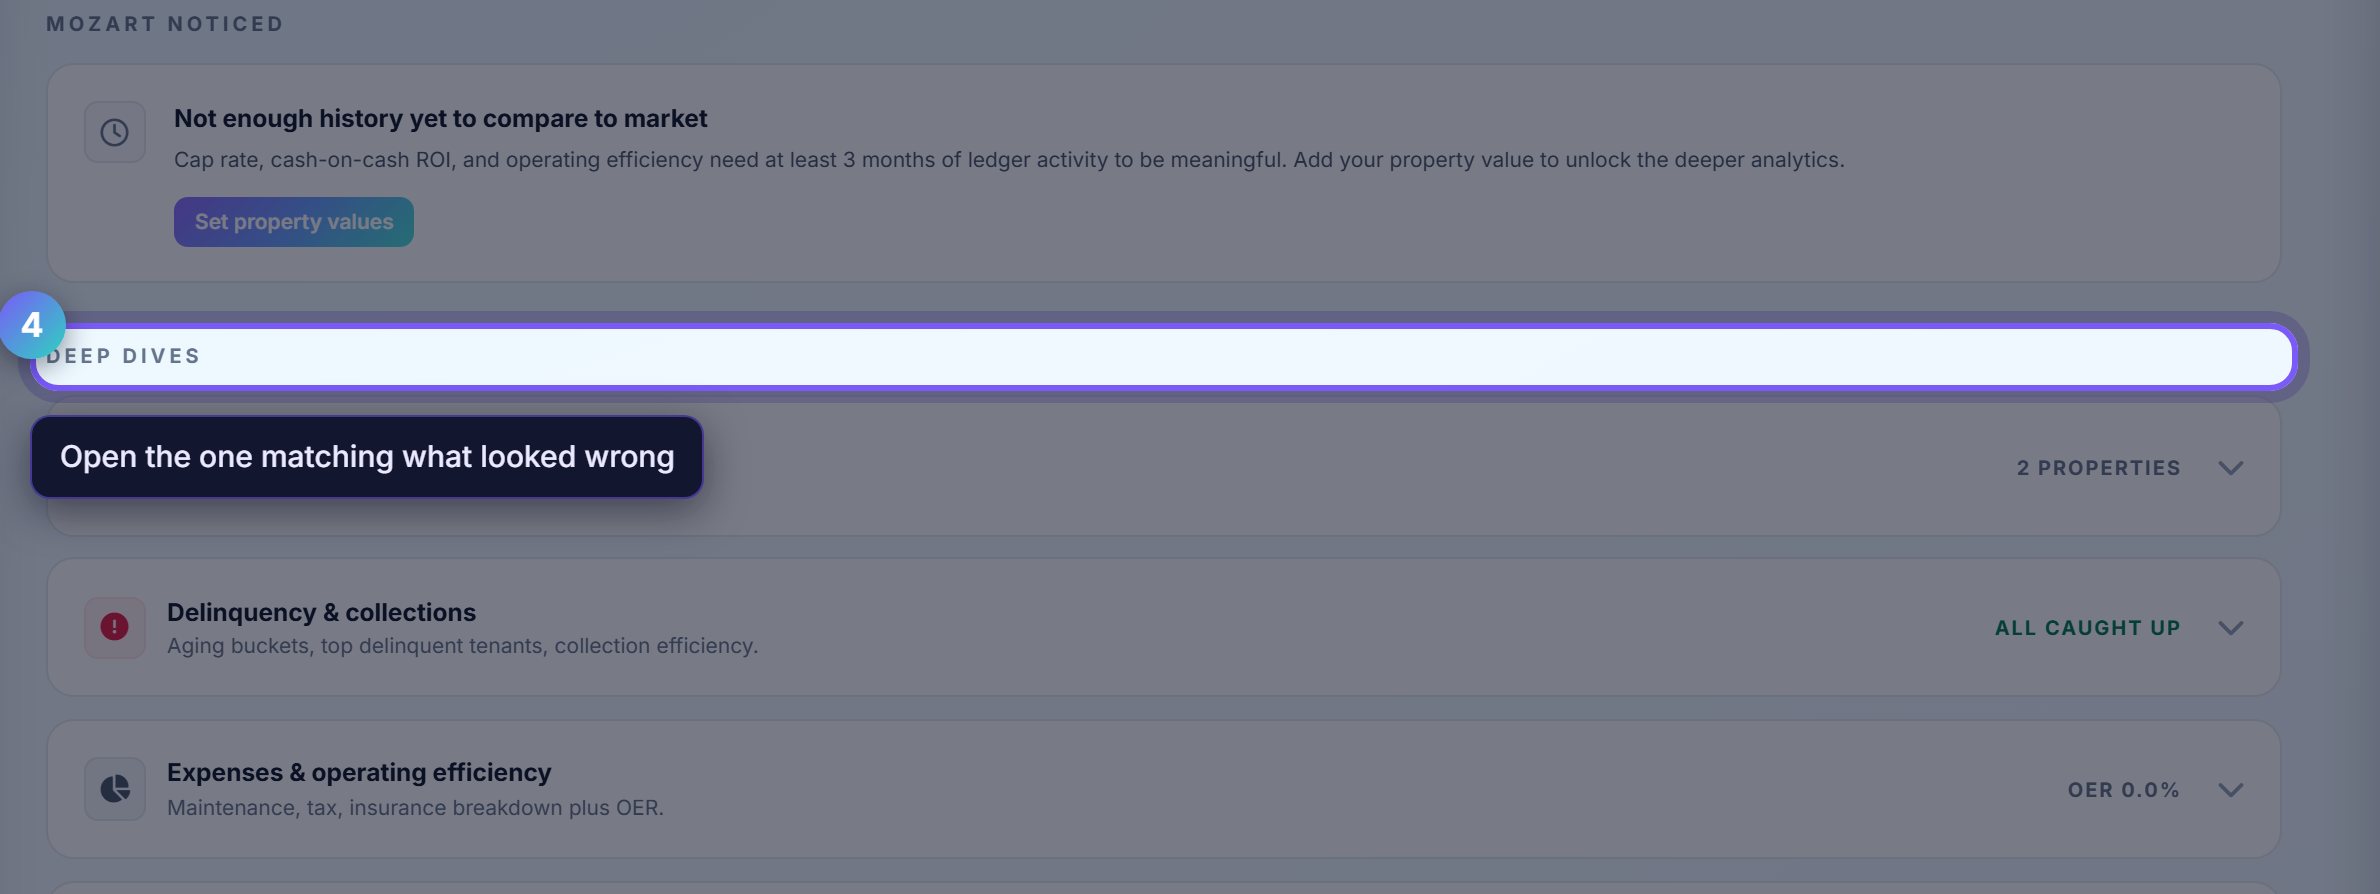
Asset performance, delinquency, expenses and leasing are the four directions a surprising number usually sends you.
Open the one that matches the thing that looked wrong rather than reading all four. They are each a full page of detail.
Where to go next
- Financial overviewThe same numbers with the tax view attached.
- Rent collectionWhere a delinquency trend gets fixed.